Analysis Of Efficient Classifier For Breast Cancer Detection Using Machine Learning 🤖


Abstract
Medical imaging is playing vital role in saving human life by detecting early stage cancer. If we detect early stages, we can save human life as well as money also. Present days going to the hospital and see the doctor is very big headache. Detection of breast cancer and classification accurately by using efficient classifier is very important.
We have implemented three classifiers namely KNN,SVM and Random forest. Then the random forest has given good accuracy compared to other classifiers. For better evaluation process using 10 fold method also implemented. Random forest classifier given best accuracy
Keywords
KNN; Random Forest; SVM; classification; Accuracy; confusion max; segmentation:
INTRODUCTION
Image processing in medical domain has a critical role in diagnosis and decision making. For automation of medical diagnosis, images captured processed through various computations to give an earlier and faster diagnosis of medical issues. With the development of new technologies, the process of computing and analysis has widened from a constraint remote processing to worldwide monitoring.
In the area of medical diagnosis, this is rapidly developing in many a fold due to the criticality in data processing and the demand of faster and accurate decision. In various domains of medical diagnosis, Breast cancers are rapidly increasing due to the stressed living lifestyle and ignorance to our health concerns. Breast cancer contributes to a large fatal case in recent years.
Wherein, the early detection can give a preventive measure in curing of such critical diseases, the delay in curing could lead to serious consequences. The automation of Mammogram is hence an optimal solution in provisioning of faster and early decision in detecting of Breast cancer. The rapid raise in breast cancer effect and a late diagnosis has a sever effect on the patient.

An early diagnosis and detection can prevent the severity in this case. Wherein early diagnosis can reduces the severity effect, the effect of capturing noise, storage noise or processing distortion has a direct impact on the diagnosis decision. The issue of region segmentation and feature selection are limited with the varying details of an image and
the accuracy of denoising operation. The overhead of classification process, where complex architectures were proposed in improving the retrieval accuracy. these existing limitation motives in developing new solution to denoising, segmentation, feature selection and classification operation offering minimal computation overhead and higher accuracy.
PROPOSED METHIOD
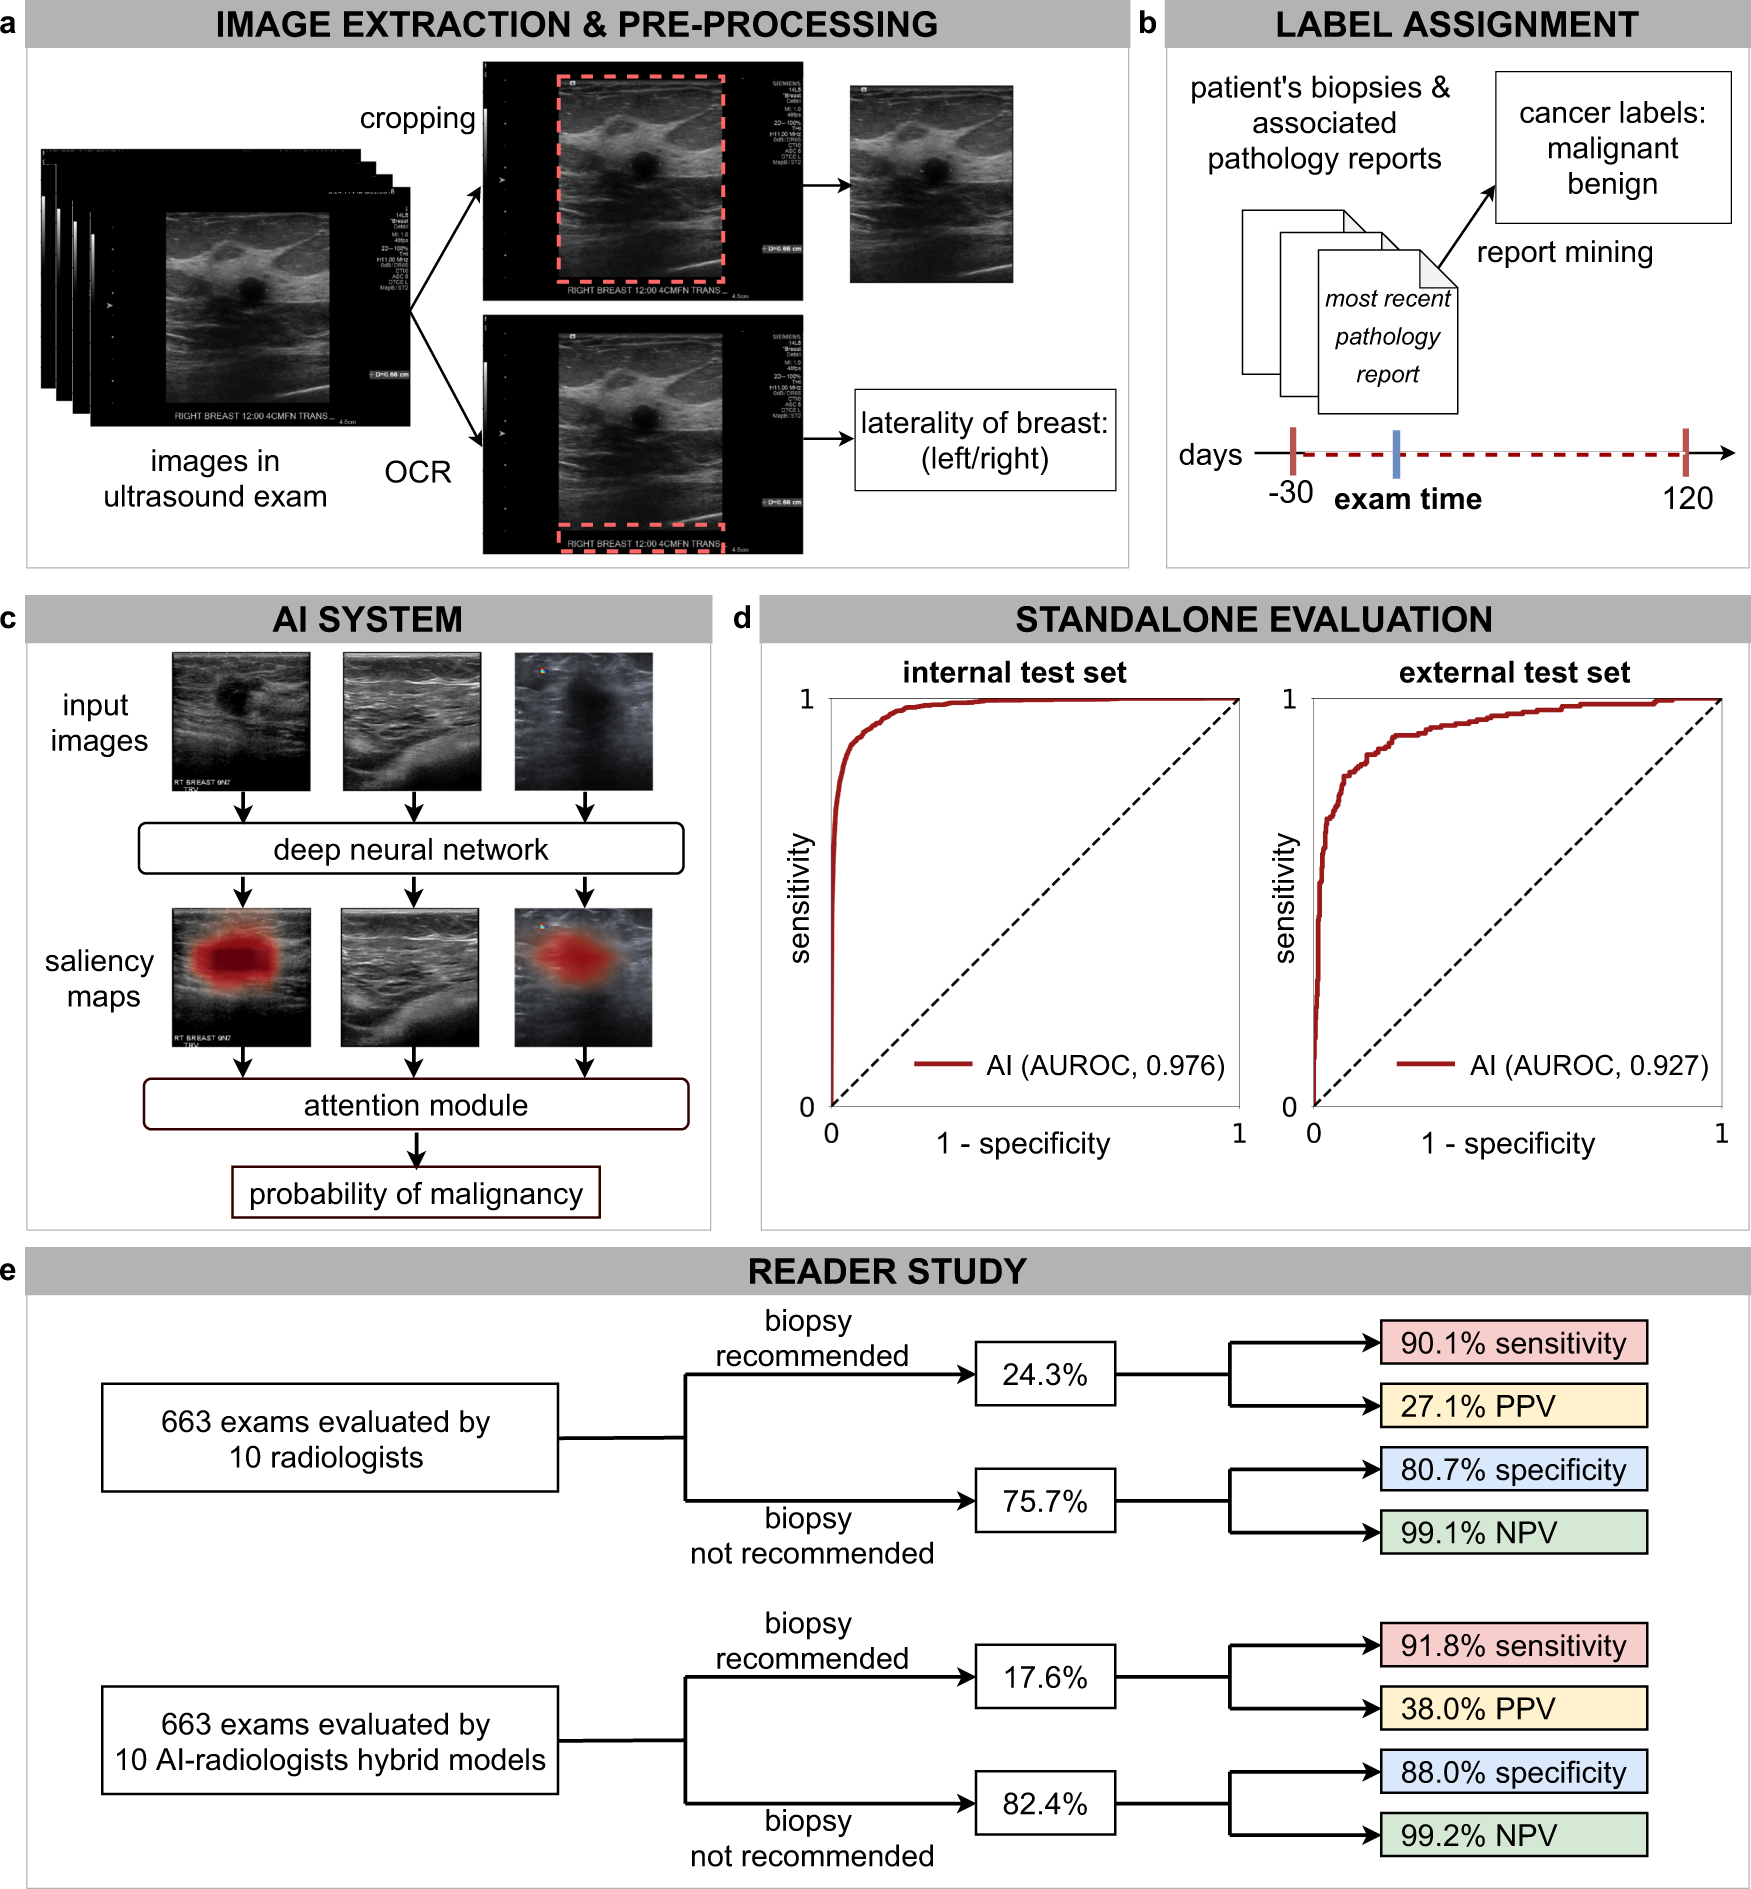
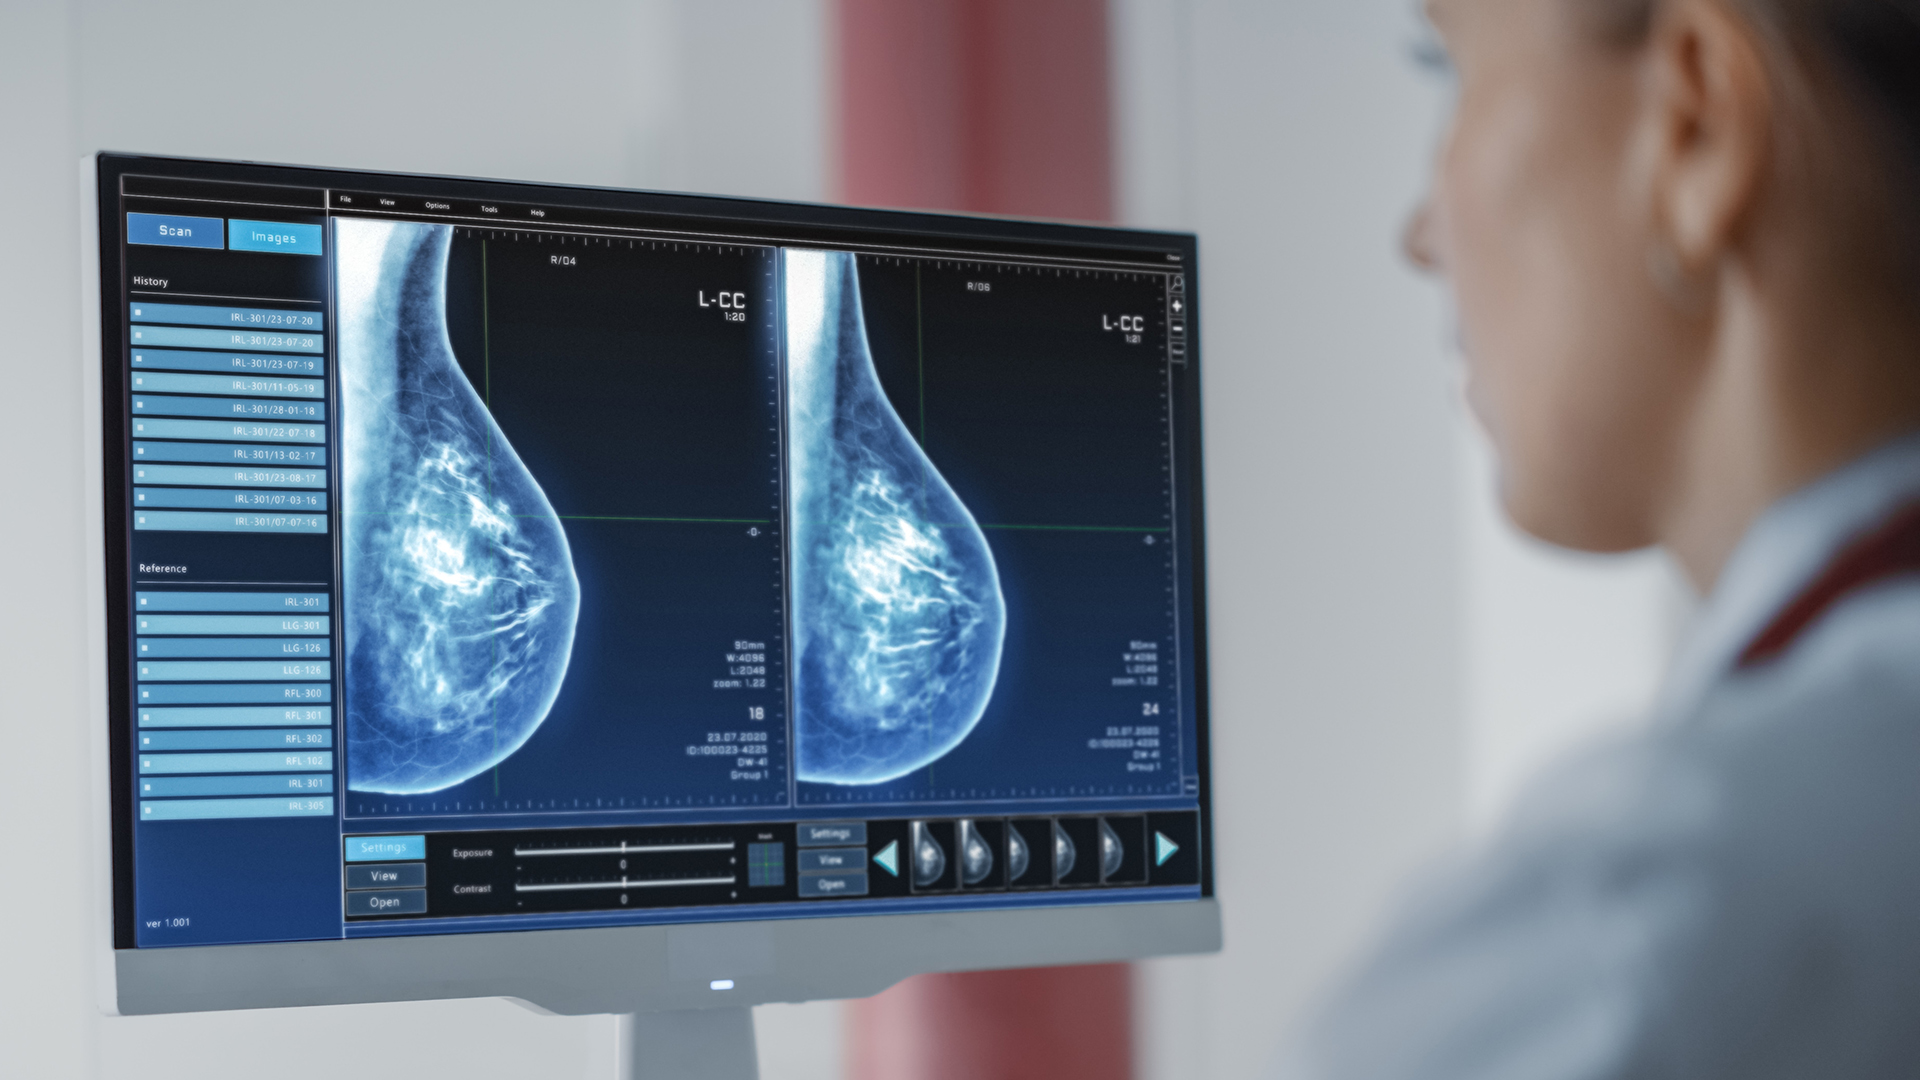
In this proposed method the below figure explains about the framework of medical image analysis process. To find malignant (cancer) effect from the given mammogram sample, a system is developed shown in figure 1. System frameworks for the classification model. It consists of 4 modules 1 preprocessing, 2 segmentation, 3 feature extraction and 4 classification. The images collected from the Cancer research center from Hyderabad. Collected images preprocessed, segmented, feature extraction and classification done by using KNN, SVM and Random forest methods. Figure 1 System frameworks for the classification model To evaluate these features, the image is processed by: 1) Adaptive decision denoising 2) Multi threshold segmentation 3) Feature selection 4) Classification process The operational flow chart of the classification system is shown in figure 2 It describes the complete analyzation process.

First we collect the images Second preprocessing removing the noise or any distortion Third segmentation find out the affected area of the image. Fourth extract the features we extracted only 6 features. It depends on the researchers some may extracted 22 features, 36 features and many more or only 12 also. We have extracted statistical and GLCM. We used hybrid features. Fifth classifiers here there are many types of classifiers are available. It depends upon the data and sample size the classifier output will change.
He we used these three classifiers that are KNN, SVM and Random forest. The data should be divided into two categories. 1 training data and 2 testing data. Based on the testing and training ratio also accuracy will change. Normally training and testing ratio will be 80% training and 20% testing 70 % training and 30 % testing for good practice for evaluation of the classifier efficiency.
In this work we have tested two types of databases. 1 MIAS database another is collected from hospital real images we developed the database. For both. the databases evaluated. The following six features are calculated by using these formulas.
Multilayer Perceptron model offered optimal performance in terms of precision, recall, and accuracy. The accuracy shown by the MLP on the training data was 96.70%, which outperformed other algorithms. These models were later tested on unseen data to analyze their real-world performance.

1. KNN classifier
The K-NN working can be explained on the basis of the below algorithm:
Step-1: Select the number K of the neighbors
Step-2: Calculate the Euclidean distance of K number of neighbors
Step-3: Take the K nearest neighbors as per the calculated Euclidean distance.
Step-4: Among these k neighbors, count the number of the data points in each category.
Step-5: Assign the new data points to that category for which the number of the neighbor is maximum.
Step-6: Our model is ready.
2. SVM
Support Vector Machine or SVM is one of the most popular Supervised Learning algorithms, which is used for Classification as well as Regression problems. However, primarily, it is used for Classification problems in Machine Learning. The goal of the SVM algorithm is to create the best line or decision boundary that can segregate n-dimensional space into classes so that we can easily put the new data point in the correct category in the future. This best decision boundary is called a hyperplane.
SVM chooses the extreme points/vectors that help in creating the hyperplane. These extreme cases are called as support vectors, and hence algorithm is termed as Support Vector Machine. Consider the below diagram in which there are two different categories that are classified using a decision boundary or hyperplane: SVM works on the line equation Y=mx+c Y is the output m= slope x= intercept
Related work
Recently, numerous studies using publicly available MIAS mammography images for BC diagnosis and classification have been proposed in the literature. In the last ten years, several computer-aided CAD diagnosis models have been presented for classifying digital mammograms based on three crucial concepts: feature extraction, feature reduction, and image classification. Several researchers have put forth several feature extraction strategies, with improvements made in the detection and classification portions4,5.
A Medical Active learning and Retrieval (Marrow) method was put forth in29 as a means of assisting BC detection. This technique, which is based on varying degrees of diversity and uncertainty, is dedicated to the relevance feedback (RF) paradigm in the content-based image retrieval (CBIR) process. A precision of 87.3% was attained. An automated mass detection algorithm based on Gestalt psychology was presented by Wang et al.30. Sensation and semantic integration, and validation are its three modules.

This approach blends aspects of human cognition and the visual features of breast masses. Using 257 images, a sensitivity of 92% was reached. In31, a hybrid CAD framework was proposed for Mammogram classification. This framework contains four modules: ROI generation using cropping operation, texture feature extraction using contourlet transformation, a forest optimization algorithm (FOA) to select features, and classifiers like k-NN, SVM, C4.5, and Naive Bayes for classification.
In32, an efficient technique for ambiguous area detection in digital mammograms was introduced. This technique depends on Electromagnetism-like Optimization (EML) for image segmentation after the 2D Median noise filtering step.
The SVM classifier receives the extracted feature for classification. With just 56 images, an accuracy of 78.57% was achieved. By combining deep CNN (DCNN) and SVM, a CAD system for breast mammography has been presented in33. SVM was used for classification, and DCNN was employed to extract features. This system achieved accuracy, sensitivity, and specificity of 92.85, 93.25, and 90.56% respectively.

In34, CNN Improvement for BC Classification (CNNI-BCC) algorithm was proposed. This method improves the BC lesion classification for benign, malignant, and healthy patients with 89.47% of sensitivity and an accuracy of 90.5%. Hassan et al.
presented an automated algorithm for BC mass detection depending on the feature matching of different areas utilizing Maximally Stable Extremal Regions (MSER)35. The system was evaluated using 85 MIAS images, and it was 96.47% accurate in identifying the locations of masses. Patil et al.
introduced an automated BC detection method36, depending on a combination of recurrent neural network (RNN) and CNN. The Firefly updated chicken-based CSO (FC-CSO) was used to increase segmentation accuracy and optimize the combination of RNN and CNN.
A 90.6% accuracy, a 90.42% sensitivity, and an 89.88% specificity are obtained. In37, a BC classification method named BDR-CNN-GCN was introduced, the is a combination of dropout (DO), batch normalization (BN), and two advanced NN (CNN, and graph convolutional network (GCN)). On the breast MIAS dataset, the BDR-CNN-GCN algorithm was run ten times, yielding 96.00% specificity, 96.20% sensitivity, and 96.10% accuracy.
For the early diagnosis of BC, Shen et al. introduced a CAD system38. To extract features, GLCM is combined with discrete wavelet decomposition (DWD), and Deep Belief Network (DBN) is utilized for classification.

To enhance DBN CA, the sunflower optimization technique was applied. The findings demonstrated that the suggested model achieves accuracy, specificity, and sensitivity rates of 91.5%, 72.4%, and 94.1%, respectively. In39, an automated DL-based BC diagnosis (ADL-BCD) algorithm was introduced utilizing mammograms.
The feature extraction step used the pretrained ResNet34, and its parameters were optimized using the chimp optimization algorithm (COA). The classification stage was then performed using a wavelet neural network (WNN). For 70% training and 90% training, the average accuracy was 93.17% and 96.07%, respectively.
In6, a CNN ensemble model based on transfer learning (TL) was introduced to classify benign and malignant cancers in breast mammograms. In order to improve prediction performance, the pre-trained CNNs (VGG-16, ResNet-50, and EfficientnetB7) were integrated depending on TL. The findings revealed a 99.62% accuracy, 99.5% precision, 99.5% specificity, and 99.62% sensitivity.
A CNN model was developed by Muduli et al. to distinguish between benign and malignant BC mammography images40. Only one fully connected layer and four convolutional layers make up the model's five learnable layers.
The findings revealed a 96.55% accuracy in distinguishing between benign and malignant tumors. Alruwaili et al. presented an automated algorithm based on TL for BC identification41. Utilizing ResNet50 for evaluation, the model had an accuracy of 89.5%, while using the Nasnet-Mobile network, it had an accuracy of 70%. The transferable texture CNN (TTCNN) is introduced in42 for improving BC categorization.

Deep features were recovered from eight DCNN models that were fused, and robust characteristics were chosen to distinguish between benign and malignant breast tumors. The results showed a sensitivity of 96.11%, a specificity of 97.03%, and an accuracy of 96.57%.
Oza et al.5 provide a review of the image analysis techniques for mammography questionable region detection. This paper examines many scientific approaches and methods for identifying questionable areas in mammograms, ranging from those based on low-level image features to the most recent algorithms.
Scientific research shows that the size of the training set has a significant impact on the performance of deep learning methods. As a result, many deep learning models are susceptible to overfitting and are unable to create output that can be generalized. Data augmentation is one of the most prominent solutions to this issue7.
According to empirical analysis, when it comes to the training-test ratio, the best results are obtained when 70–90% of the initial data are used for training and the rest are used for testing43,44. In addition, 70%, 80%, and 90% dataset splitting ratios are most frequently used for training, as seen in12,13,18,23,31,39, and16,30,39,41, respectively.

Considering this, it can be said that numerous researchers have examined BC detection and classification and have put up various solutions to this issue. However, the majority of them fell short of the necessary high accuracy, particularly for cases belonging to the three classes of benign, malignant, and healthy cases. As a result, the proposed study aims to improve the automatic classification of breast mammography patches as normal, benign, or malignant. This is possible by combining features from three separate pretrained architectural deep learning networks. The robust high-ranking features are then extracted using the TV feature selection approach. They fed the MSVM classifier to finish the classification task.
The methodology
The goal of this work was to enhance a mammogram-based BC diagnosis model employing 3-class cases. Following is a detailed explanation of the prepared dataset and the suggested methodology.
Dataset
The MIAS created and provided the applied digital mammography datasets, which are widely utilized and freely accessible online for research. The images dataset was introduced in Portable Gray Map (PGM) image format. Each mammography in a Mini-MIAS image has a left- and right-oriented breast and is classified as normal, benign, or malignant.
Three different forms of breast background tissue are shown in this collection of images: fatty (F), dense-glandular (D), and fatty-glandular (G). The radiologists' ground truth estimates of the abnormality's center and a rough estimate of the circle's radius enclosing the abnormality.
This indicates where the lesion is, so we do a cropping operation on the mammograms that were taken from the standard dataset to extract the ROI of any abnormal area. Mammogram abnormalities or ROIs are extracted and labeled as image patches. For normal mammograms, the ROI is randomly chosen. Table 1 contains a list of the segregated ROI image patches.
Conclusion
This paper proposes and tests a new automated BC detection and classification algorithm with the fewest possible features. The Inception-V3, ResNet50, and AlexNet CNN models, three of the most popular pretrained architectures, provided the effective DL features used in this model. In the two stages of the experiment, the TV algorithm is applied twice for the selection of robust high-ranking features. Using the TV algorithm, features are chosen from each distinct DL CNN model in the initial stage and provided to the MSVM classifier independently. 3500 robust features were left out of the original 8192 features.
These features were subjected to the TV algorithm once more, which reduced them to 600 weighted features that influence classification performance. MSVM was utilized to classify the first 100, 200, 300, 400, 500, and 600 features with the highest feature weight.
The newly proposed hybrid technique, which combines CNNs + TV + MSVM, obtained 97.81% for training on 70% of the data, 98% for training on 80% of the data, and meets the ideal value of 100% for training on 90% of the data.
When compared with separate DL CNN models, i.e., InceptionV3, ResNet 50, and AlexNet, as well as other studies in the literature, the suggested hybrid technique achieves the highest performance for BC diagnosis. The importance of the proposed network's key parameters is highlighted using the ablation analysis.